Can Kentik end the performance blame game?
As part of the?Tech Field Day Extra?crew at?Interop 2016, I got to sit in on a great presentation by?Avi Freedmanfrom?Kentik.
I?d?never heard of them, which is not surprising given my Australian-based SMB world, but I sat with an open mind as Avi talked about Enterprise (and larger) networking concepts. It?s always so great when a presenter makes it ?real world? enough that you can see the benefits, without necessarily understanding all the tech under the hood. Seems that the world is hearing about Kentik though as their customers already include yelp, Pandora, Box, and openDNS.
Kentik is a startup focussed on network traffic analysis. In their own words ?Kentik provides modern network visibility, anomaly detection, performance and security intelligence.?? Their software can run on-premise or licensed from them as a SaaS application, with the annual subscription fee based solely on the number of sources (routers or hosts) sending flow to the system. Subscribers pay no installation fees, no per-seat fees, no storage fees, and no data volume fees.
Kentik analyses data sourced from NetFlow/IPFIX and/or PCAP/sniffing and will work on your own structure or with a hybrid network environment.
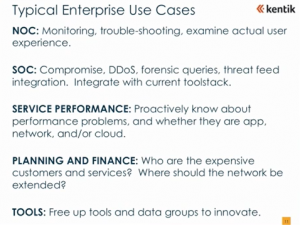
The key to this analytics tool is using the same data for multiple purposes, whether that?s attack detection, service performance, efficiency, customer experience or security. It aims to break the silos with one platform and a unified schema that doesn?t care what the data source is.
It supports routers & switches (standard flow & augmented flow ie Cisco AVC), Sensors:base or augmented IPFIX, sFlow or Netflow, load balancers & other network elements supporting flow export and even Hosts & Hypervisors via Kentik?s host agent.
The tool is open via REST and SQL APIs.
All data retained is retained and consumable data is available in seconds. To achieve this, they wrote their own data engine because nothing else would do the job.
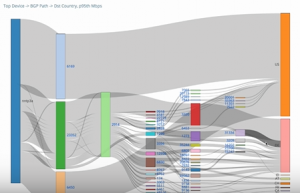
The Kentik portal includes ALL the dashboards and some seriously stunning visualisations, ranging from simple network flow diagrams:
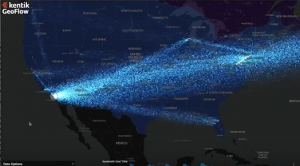
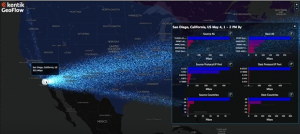
to animated ?star field? map overlays:
To view a demo of the portal, visit?https://www.youtube.com/watch?v=8XqNWv_YUFc&list=PLinuRwpnsHad3bp4bZFiLocaUrRf9yH-d&index=5?(The star field demo starts at 10:50).
Alerting comes from SQL queries that are pre-populated and you can edit the parameters. This means that they?ve already filtered out the minor event noise for you. It?s even possible to use the geolocation to see data exfiltration. The new version also includes baselining, which is brilliant for measuring the real impact of changes.
With so much control over your network data, it?s possible to drill down to the detail of client latency versus application latency. This is how you end the performance ?blame game? ? with indisputable insights backed by data.
Looks like my ?It?s the network, not my server!?? days are numbered! Sys admins beware!
-SCuffy
P.S. Kidding, it?s always the network, right?
P.P.S To view the full presentation given to the Tech Field Day Extra crew, visit?https://www.youtube.com/watch?v=CKeAu7vYglg&list=PLinuRwpnsHad3bp4bZFiLocaUrRf9yH-d&index=4
P.P.P.S I attended the Kentik presentation as a guest of Tech Field Day Extra and have not been paid to write this post.